
Macroeconomics Explained
Explore economy-wide indicators: GDP, inflation, unemployment, fiscal & monetary policy.
- 24 hours
- Stage: University basics
- Language: English
- Voice: English ✔
What you will learn
- Measure GDP via expenditure (C + I + G + NX), income and production approaches, and show in a worked example that the approaches give the same total.
- Distinguish nominal vs. real GDP and calculate the GDP deflator and real growth rates from price and quantity data for a simple multi-good economy.
- Calculate the CPI inflation rate from a basket of goods and compare core vs. headline measures, explaining why food and energy are often excluded from core.
- Define money-supply aggregates (M0, M1, M2, M3), explain central-bank controls, and describe the macro effects of money growth on prices, interest rates and output.
- Analyze types of unemployment: frictional, structural, cyclical, matching each type to its typical cause and policy response.
- Explain aggregate demand and supply model dynamics, showing how demand shocks and supply shocks change the price level and output in the short run and the long run.
- Evaluate fiscal policy tools (spending, taxation) and their business impacts, using examples of how a tax change or a public project changes demand for firms.
- Explain monetary policy tools (open market operations, discount rate, reserve requirements) and transmission mechanisms from policy rates to borrowing, spending and prices.
- Interpret the Phillips curve trade-off between inflation and unemployment, and explain why the short-run trade-off can shift when expectations change.
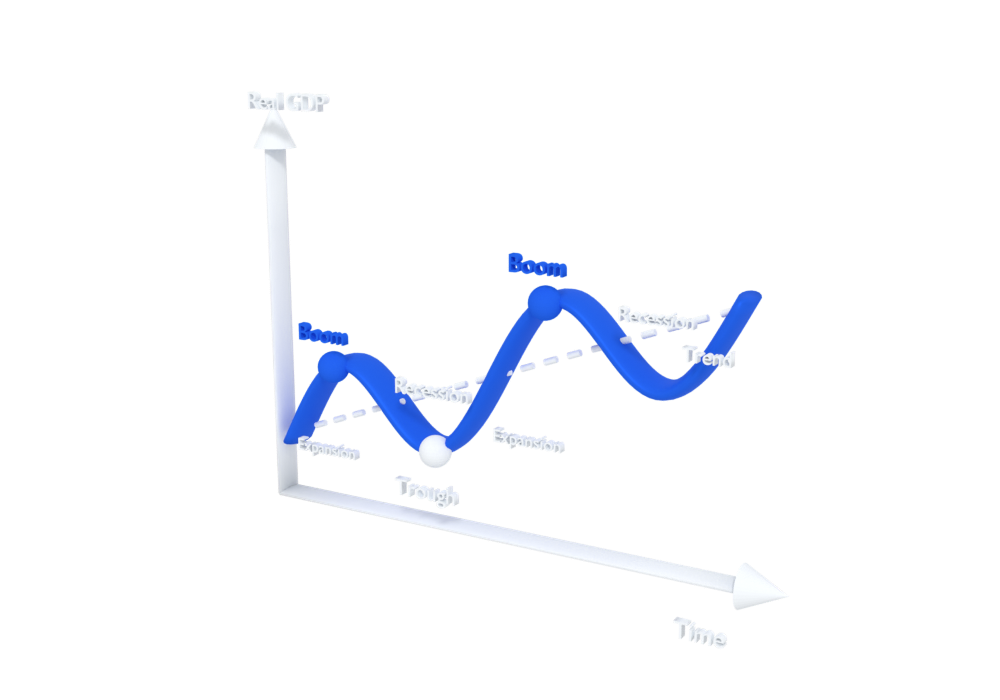
- Analyze business cycles (expansion, peak, recession, trough) by locating each phase on a GDP chart and linking it to typical movements in employment, output and spending.
- Assess the multiplier effect on aggregate output by calculating it from the marginal propensity to consume and applying it to a change in spending.
Syllabus
Module 1Measuring Output and Growth3 hours
GDP by three approaches · nominal vs real GDP · the GDP deflator · GDP per capita · sources of long-run growth
- GDP and the circular flow of income
- Expenditure, income and production in a worksheet
- Worked example: one small economy, three equal totals
- Nominal and real GDP — why prices blur growth
- Real GDP and the deflator from price tables
- Worked case: a three-good economy over two years
- GDP per capita and the real growth rate
- Sources of long-run growth: capital, labor, technology
- Case: two sample economies with different growth paths
Module 2Prices, Inflation and Money3 hours
CPI and the basket · core vs headline · demand-pull and cost-push · who gains and loses · M0 to M3 · central-bank controls
- The consumer basket and how a price index is built
- Calculating CPI inflation in a spreadsheet
- Core vs headline: why food and energy are set aside
- Demand-pull and cost-push inflation
- Sorting a real price story with a checklist
- Who gains and who loses when inflation is a surprise
- What counts as money: the M0 to M3 aggregates
- How a central bank controls the money supply
- Money growth, prices, interest rates and output
Module 3Jobs and the Business Cycle3 hours
Labor force · unemployment and participation rates · discouraged workers · frictional, structural, cyclical · cycle phases
- Who is in the labor force
- Calculating the unemployment and participation rates
- Discouraged workers and the hidden side of the headline rate
- Frictional, structural and cyclical unemployment
- Matching each type to its policy response
- Case: a factory closes while hiring grows elsewhere
- Expansion, peak, recession and trough
- Marking the phases on a GDP chart
- How jobs, output and spending move through the cycle
Module 4Aggregate Demand and Supply3 hours
Demand and supply curves · shocks · the multiplier · sticky wages · potential output and the output gap
- Aggregate demand and aggregate supply: the big picture
- Drawing the demand and supply model step by step
- Demand shocks and supply shocks, short run and long run
- Marginal propensity to consume and rounds of spending
- Calculating the multiplier step by step
- Case: a spending increase ripples through output
- Sticky wages and prices: why adjustment is slow
- Potential output and the output gap
- Case: a slowdown leaves workers idle
Module 5Interest Rates and Central Banks3 hours
Loanable funds · open market operations · discount rate and reserves · transmission · Phillips curve · expectations
- The market for loanable funds
- Reading the market on a simple graph
- Case: savings rise, or businesses want to expand
- Central bank tools: open market, discount rate, reserves
- From a policy-rate move to borrowing, spending and prices
- Reading a rate decision as a business owner
- The Phillips curve trade-off
- Plotting inflation against unemployment
- When expectations change, the curve shifts
Module 6Government Budgets and Policy3 hours
Spending and taxes · deficits, surpluses and debt · crowding out · automatic stabilizers · policy lags
- Government spending and taxes as demand tools
- Estimating a tax change's effect on a firm
- Case: a public project and the firms around it
- Deficits, surpluses and public debt
- Building a simple government budget table
- Crowding out: when borrowing squeezes private investment
- Automatic stabilizers vs discretionary policy
- Policy lags: recognition, action and impact
- Case: a stimulus that arrives after the recovery
Module 7The World Economy and Reading Data3 hours
Exchange rates · balance of payments · leading and lagging indicators · reading a data release · limits of GDP
- Exchange rates and the balance of payments
- Converting prices and measuring a currency move
- Case: a weaker currency, an exporter and an importer
- Leading, coincident and lagging indicators
- Reading a data release step by step
- Judging where the economy sits in the cycle
- What GDP misses: unpaid work and the informal economy
- Inequality, environment and other well-being measures
- Case: output is up, daily life is not
Module 8Macro in Practice3 hours
Demand slump and energy shock cases · fiscal and monetary mix · one-page dashboard · common reasoning errors
- Case 1: a demand slump on the model
- Case 2: an energy-price shock on the model
- Choosing the fiscal and monetary mix
- Choosing the four indicators and their sources
- Building the one-page dashboard
- Writing the summary of the current picture
- Common error 1: mixing nominal and real values
- Common error 2: ignoring policy lags
- Common error 3 and a review checklist