
Financial Statement Analysis
Read and analyze financial statements to extract actionable business insights.
- 24 hours
- Stage: University basics
- Language: English
- Voice: English ✔
What you will learn
- Navigate balance sheets, income statements and cash-flow statements, locate the key line items and explain how the three statements connect to each other.
- Perform vertical/common-size analysis of financial statements by expressing each line as a percentage of revenue or total assets, and interpret the structure that results.
- Conduct horizontal/trend analysis across periods by calculating changes and growth rates, and distinguish one-off movements from lasting trends.
- Calculate liquidity ratios (current, quick) and interpret them to spot short-term solvency issues, noting how inventory and receivable quality affect the result.
- Compute leverage ratios (debt/equity, interest coverage) and judge financial risk by comparing debt levels with the earnings and cash available to service them.
- Analyze profitability ratios (ROA, ROE, margin), including gross, operating and net margin, to assess operational performance and the drivers behind it.
- Derive cash-flow ratios (OCF/EBITDA, FCF/debt) and use them to judge cash-flow health by comparing cash generation with reported profit.
- Benchmark ratios against industry peers and prior periods, choosing comparable companies and explaining differences caused by business model, size or accounting choices.
- Visualize trends with charts and dashboards that use the right chart type, label units clearly and keep the key message visible.
- Summarize findings in concise management reports that state the conclusion first, support it with evidence and list the follow-up questions.
Syllabus
Module 1The Basics of Statement Analysis3 hours
Accrual accounting · accounting equation · why ratios compare size · the three statements · policies and notes · auditor’s report
- Accrual accounting — recording when it happens, not when cash moves
- The accounting equation as a check on every statement
- Why ratios remove size — a shop and a chain side by side
- The three statements — what each one tells you
- Finding the key lines in a real annual report
- One sale followed through all three statements
- Accounting policies — why the same event can show different numbers
- Finding policies, notes and the auditor’s report in a filed report
- A note that changes how a ratio should be read
Module 2Common-Size, Trend and Clean Numbers3 hours
Vertical analysis · horizontal analysis · growth rates · one-off versus lasting · adjusted figures
- Vertical analysis — every line as a share of one base
- Building common-size statements in a spreadsheet
- Reading the structure of a retailer’s income statement
- Horizontal analysis — change and growth across periods
- A multi-period trend table in a spreadsheet
- One-off jump or lasting trend — a worked example
- Non-recurring items — what they are and why they distort
- Finding one-offs in the notes and adjusting a statement
- Reported versus adjusted margin — a worked example
Module 3Liquidity, Efficiency and Debt3 hours
Current and quick ratios · inventory and receivable quality · turnover and days · debt to equity · interest coverage
- Liquidity — can the company pay what it owes soon?
- Computing current and quick ratios from a balance sheet
- A healthy ratio hiding slow stock and late customers
- Efficiency — how fast assets turn into sales and cash
- Efficiency ratios on a worksheet
- The cash cycle of a trading company — a worked example
- Leverage — how debt adds return and risk
- Debt to equity and interest coverage from filed statements
- Two companies, same profit, different debt
Module 4Profitability and Shareholder Returns3 hours
Gross, operating and net margin · ROA · ROE · ROE breakdown · earnings per share
- Profitability — margins and returns, and what they measure
- Margin and return ratios on a worksheet
- Net margin fell while gross margin held — a worked example
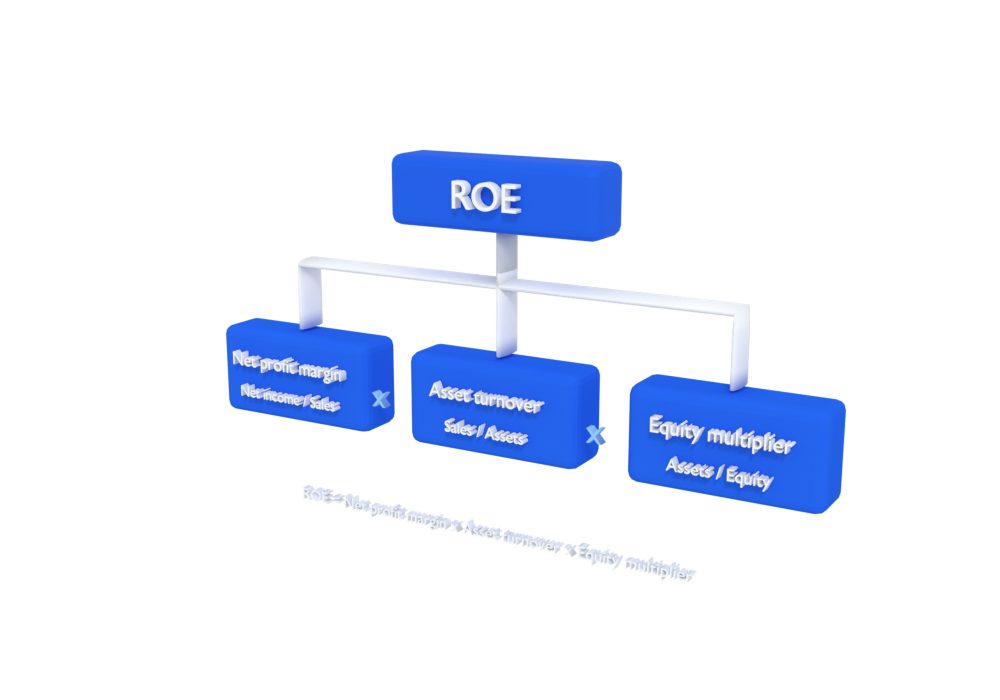
- The three drivers of ROE
- Splitting ROE into its three parts in a spreadsheet
- Same ROE, different route — a worked example
- Earnings per share — what it is and what moves it
- Calculating EPS when the share count changes
- EPS up, business unchanged — a worked example
Module 5Cash Flow and Earnings Quality3 hours
Cash-flow ratios · profit versus operating cash · cash conversion · red flags · follow-up questions
- Cash-flow ratios — what OCF/EBITDA and FCF/debt measure
- Building cash-flow ratios from the cash-flow statement
- Strong profit, weak cash generation — a worked example
- Earnings quality — why profit and cash should travel together
- Tracking the gap between net income and operating cash flow
- A gap that widens for three periods — a worked example
- Red flags — what they are and why each one matters
- A red-flag checklist with a follow-up question for each
- Receivables outgrow revenue as borrowing rises — a worked example
Module 6Workbook, Benchmarks and Limits3 hours
Ratio workbook · linked formulas · consistency checks · peers and prior periods · limits of ratios
- How a ratio workbook is built — inputs, ratios, outputs
- Linked ratios and consistency checks in a spreadsheet
- A consistency check that catches a data-entry error
- Benchmarking — choosing peers and periods that compare fairly
- Pulling peer data from public reports into the workbook
- Explaining a gap between two peers — a worked example
- Why ratios can mislead — policies, year-ends and seasonality
- Average versus year-end balances — recalculating in a spreadsheet
- Same company, different year-end, different ratio — a worked example
Module 7Charts, Reports and Honest Reporting3 hours
Chart types · clear units · dashboards · conclusion-first reports · follow-up questions · objective tone
- Choosing the right chart for the message
- A clean ratio chart and a one-page dashboard
- The same data, a poor chart and a good chart
- The shape of a management report — conclusion, evidence, questions
- A one-page management report template
- From a ratio table to three clear sentences — a worked example
- Objectivity — showing bad news as clearly as good news
- Stating data sources and limits in a report
- Rewriting a one-sided summary into a balanced one
Module 8Full Analysis and What Comes Next3 hours
Multi-period analysis · profit versus cash case · conclusions · corporate finance · valuation · advanced reporting
- Planning a full analysis — questions, periods, steps
- Running the workbook on one company across several periods
- Presenting conclusions on liquidity, leverage, profitability and cash
- Why reported profit and cash can move apart
- A case template — profit and cash on one timeline
- A growing company with rising profit and falling cash
- Statement analysis as the first step of corporate finance
- From ratios to valuation — the inputs an analyst takes from statements
- A finding that points to advanced financial reporting